02Which communities change
Microbiome Xplorer combines layers according to the question.
CASE STUDY · MICROBIOME · GUT–BRAIN AXIS
How Microbiome Xplorer combines standardised sampling, strain-resolved metagenomics, metatranscriptomics, metabolomics and host markers to show which communities change, which functions they carry and how the host responds, an illustrative study.
Illustrative case study. This scenario shows how Microbiome Xplorer is applied to a gut–brain question. It does not describe a specific client project or product: study size, results and timelines are indicative and depend on the intervention, the matrices and the study design. Microbiome Xplorer is a research service; it does not diagnose or treat any condition.
Download the full case study (10 pages, PDF)
Gut, oral, skin, vaginal or any matrix, collected and stabilised to standard
Which taxa and strains change, in absolute terms
Which functions they carry, and which are switched on
Which signals reach the host, and what it means
A nutrition company had developed a three-strain probiotic for stress and well-being and was running a randomised, double-blind, placebo-controlled trial in 120 healthy adults with moderate perceived stress. The clinical endpoints were in place. What was missing was the mechanism: does the product actually act through the microbiota–gut–brain axis1, and how?
The brief: show which communities change, which functions they carry and how the host responds, and where the chain breaks.
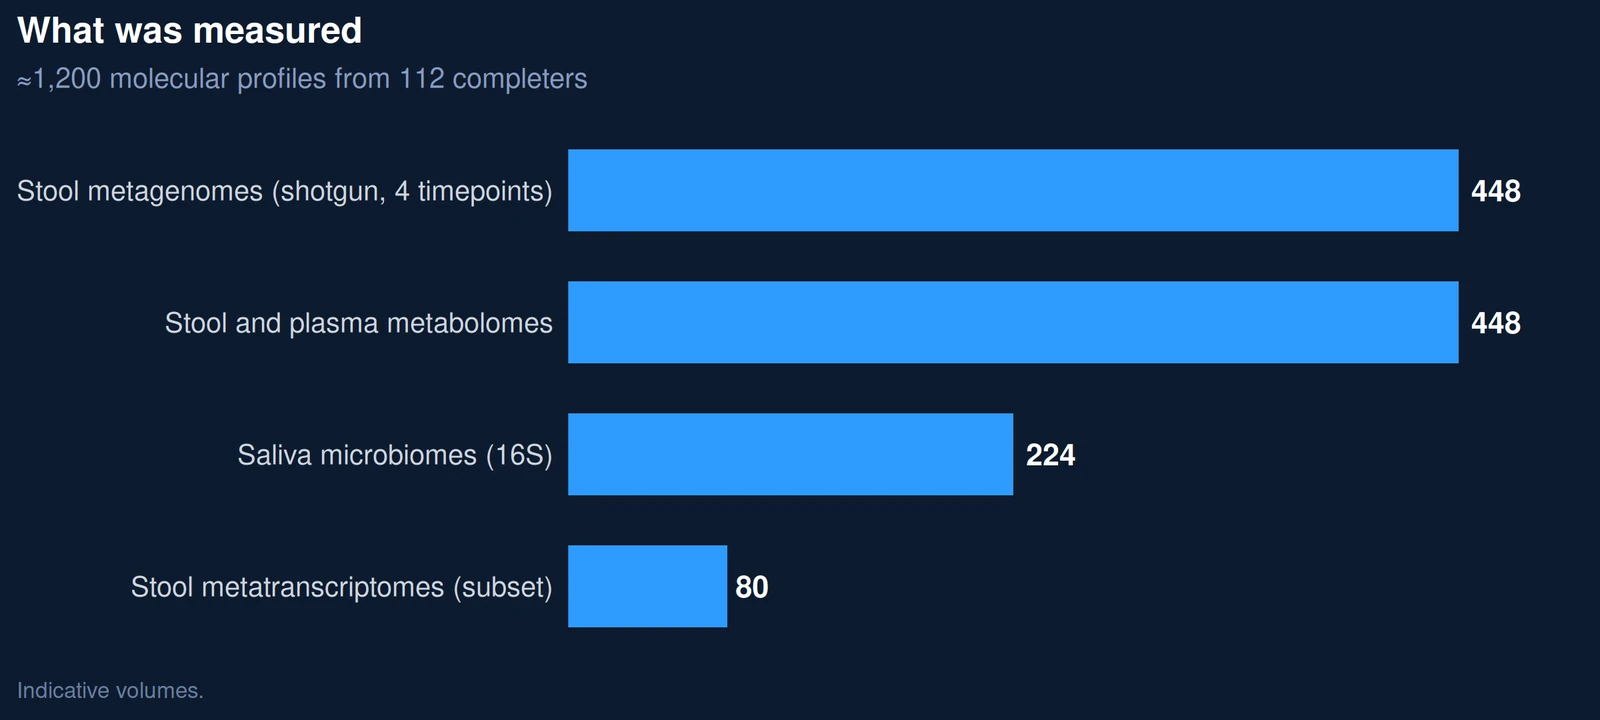
The trial was the client’s; the sampling design was built with them before the first participant was enrolled. Each matrix was chosen for the question it answers: stool for the gut community and its products, saliva for the oral microbiome and the cortisol awakening response, and blood for circulating metabolites and inflammatory markers.
Microbiome Xplorer combines layers according to the question.
Species names say who is there; functions say what they can do. Metagenomes and metatranscriptomes were mapped to curated gut–brain modules, microbial pathways that produce or degrade neuroactive compounds18.
A microbiome change matters only if the host responds. Each link of the chain, from product to perceived stress, was tested rather than assumed.
In the gut
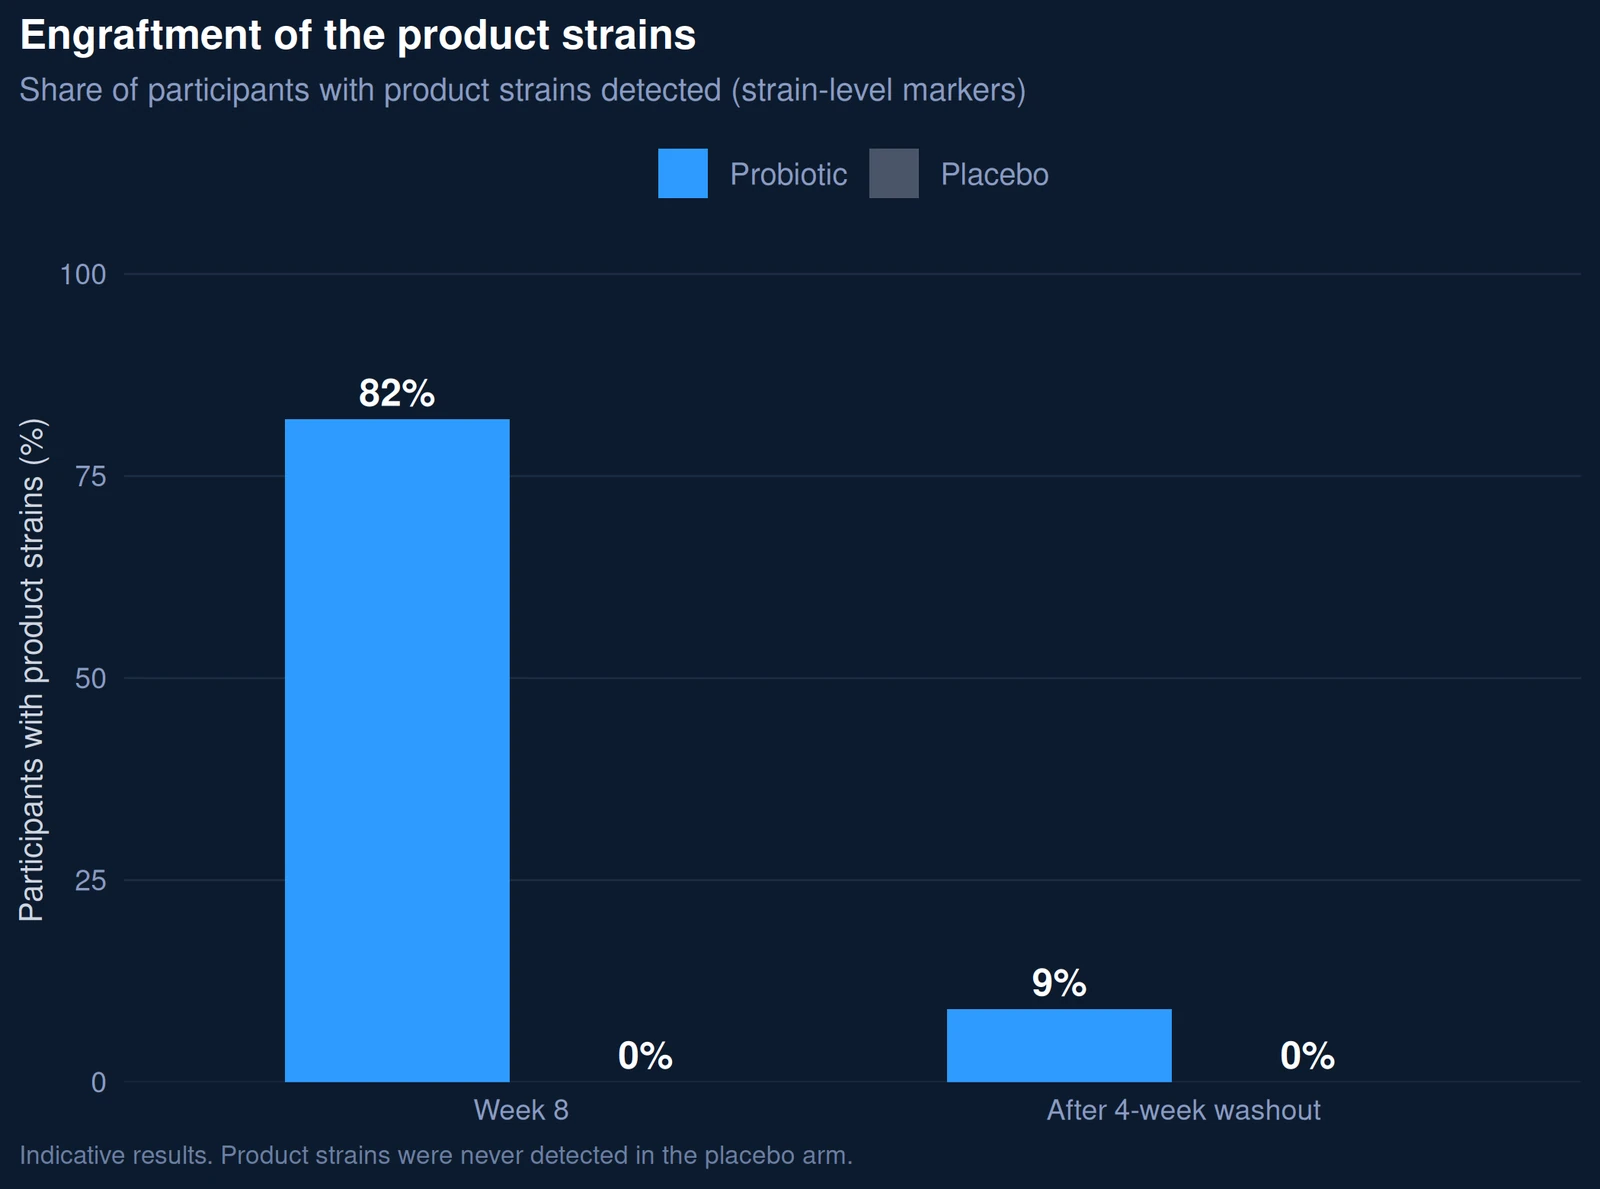
1Product strains engraft
Detected in 82% at week 8
9% after washout
Supported · transient2Community shifts
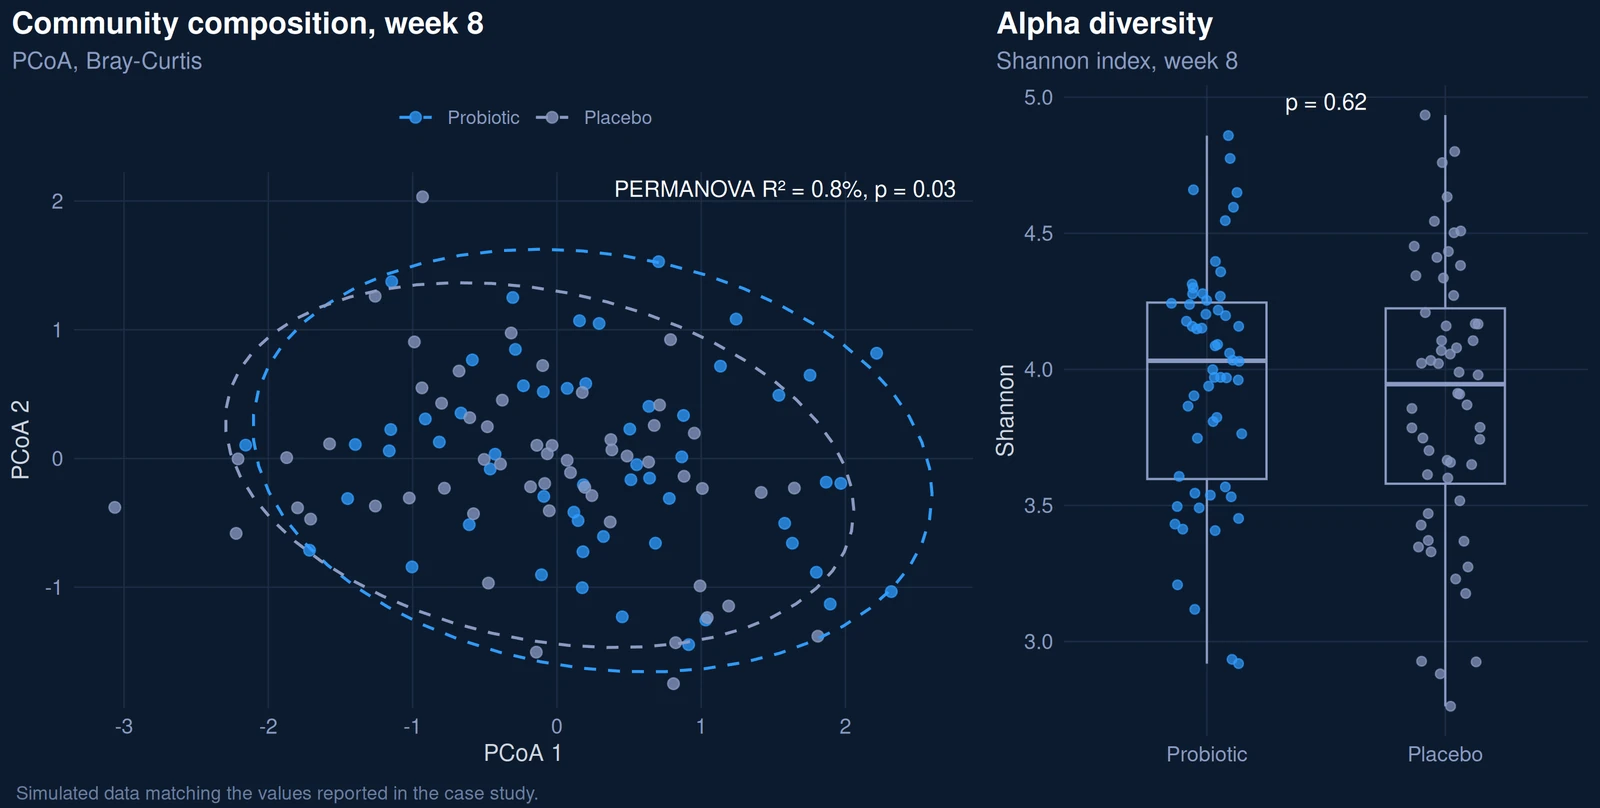
Small overall shift (R² 0.8%)
Butyrate producers ↑
Modest3Functions switch on
Butyrate, GABA, indole pathways ↑ (DNA and RNA)
SupportedIn the host
4Metabolites reach the host
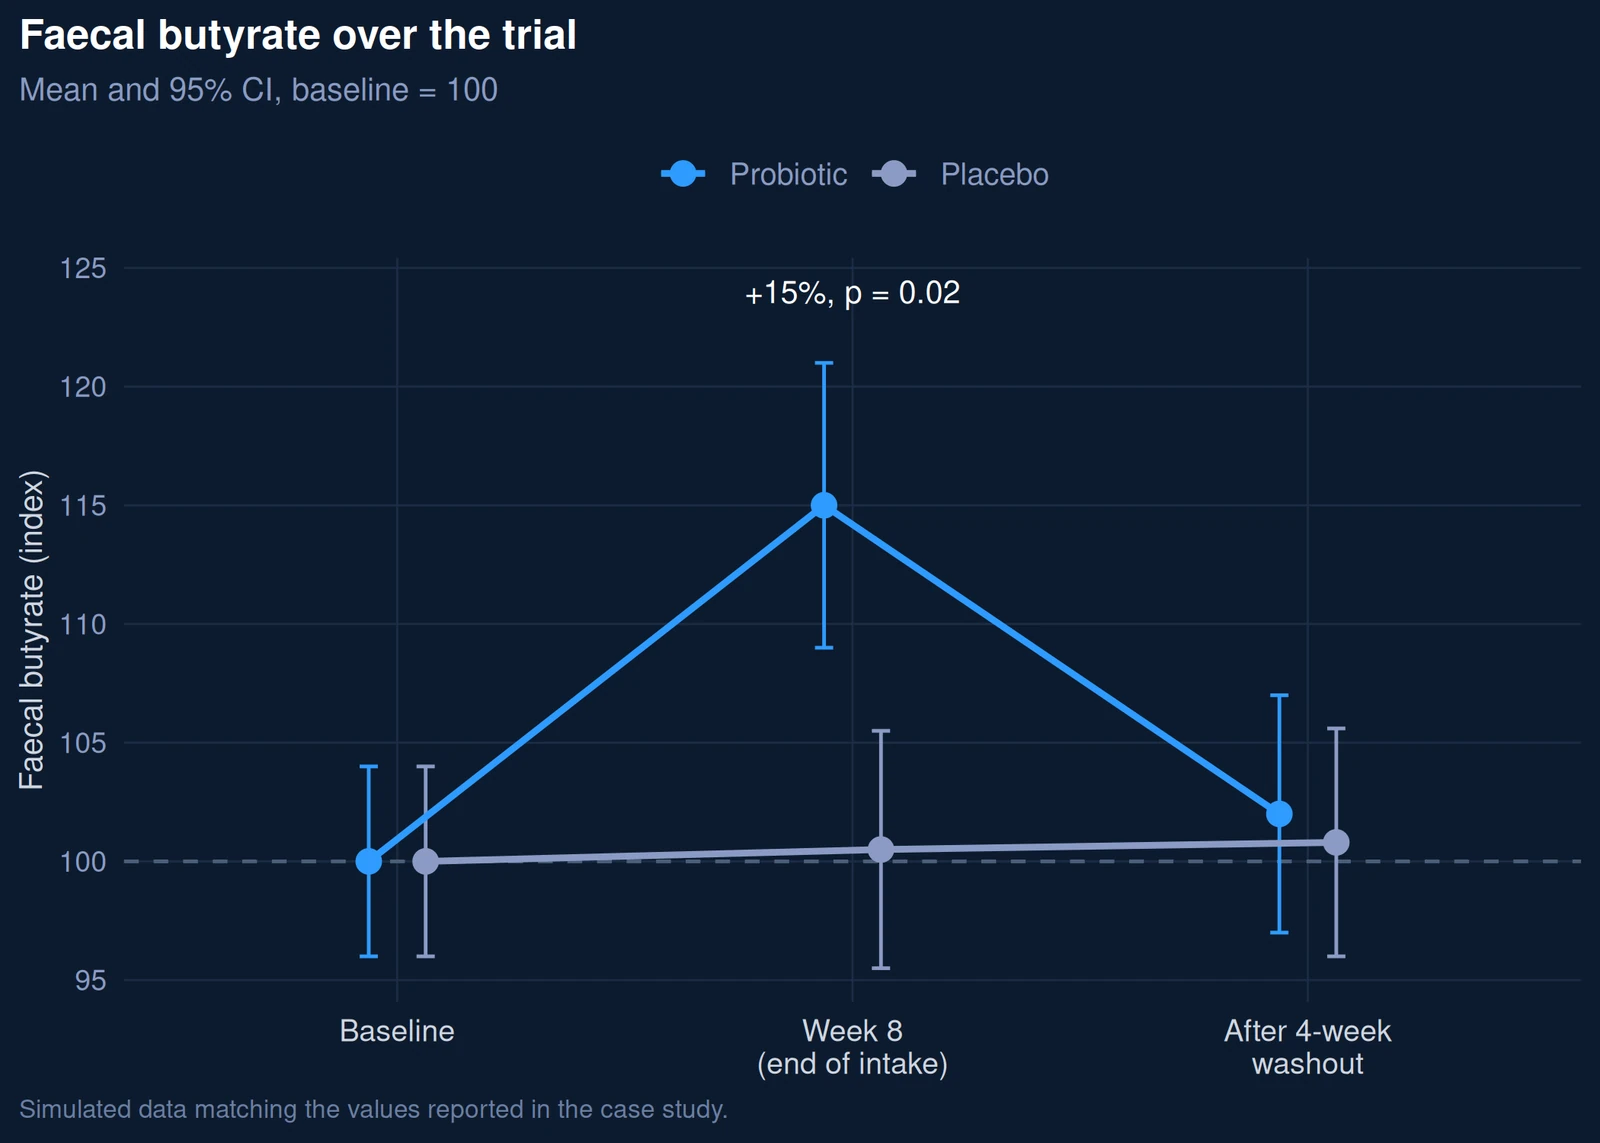
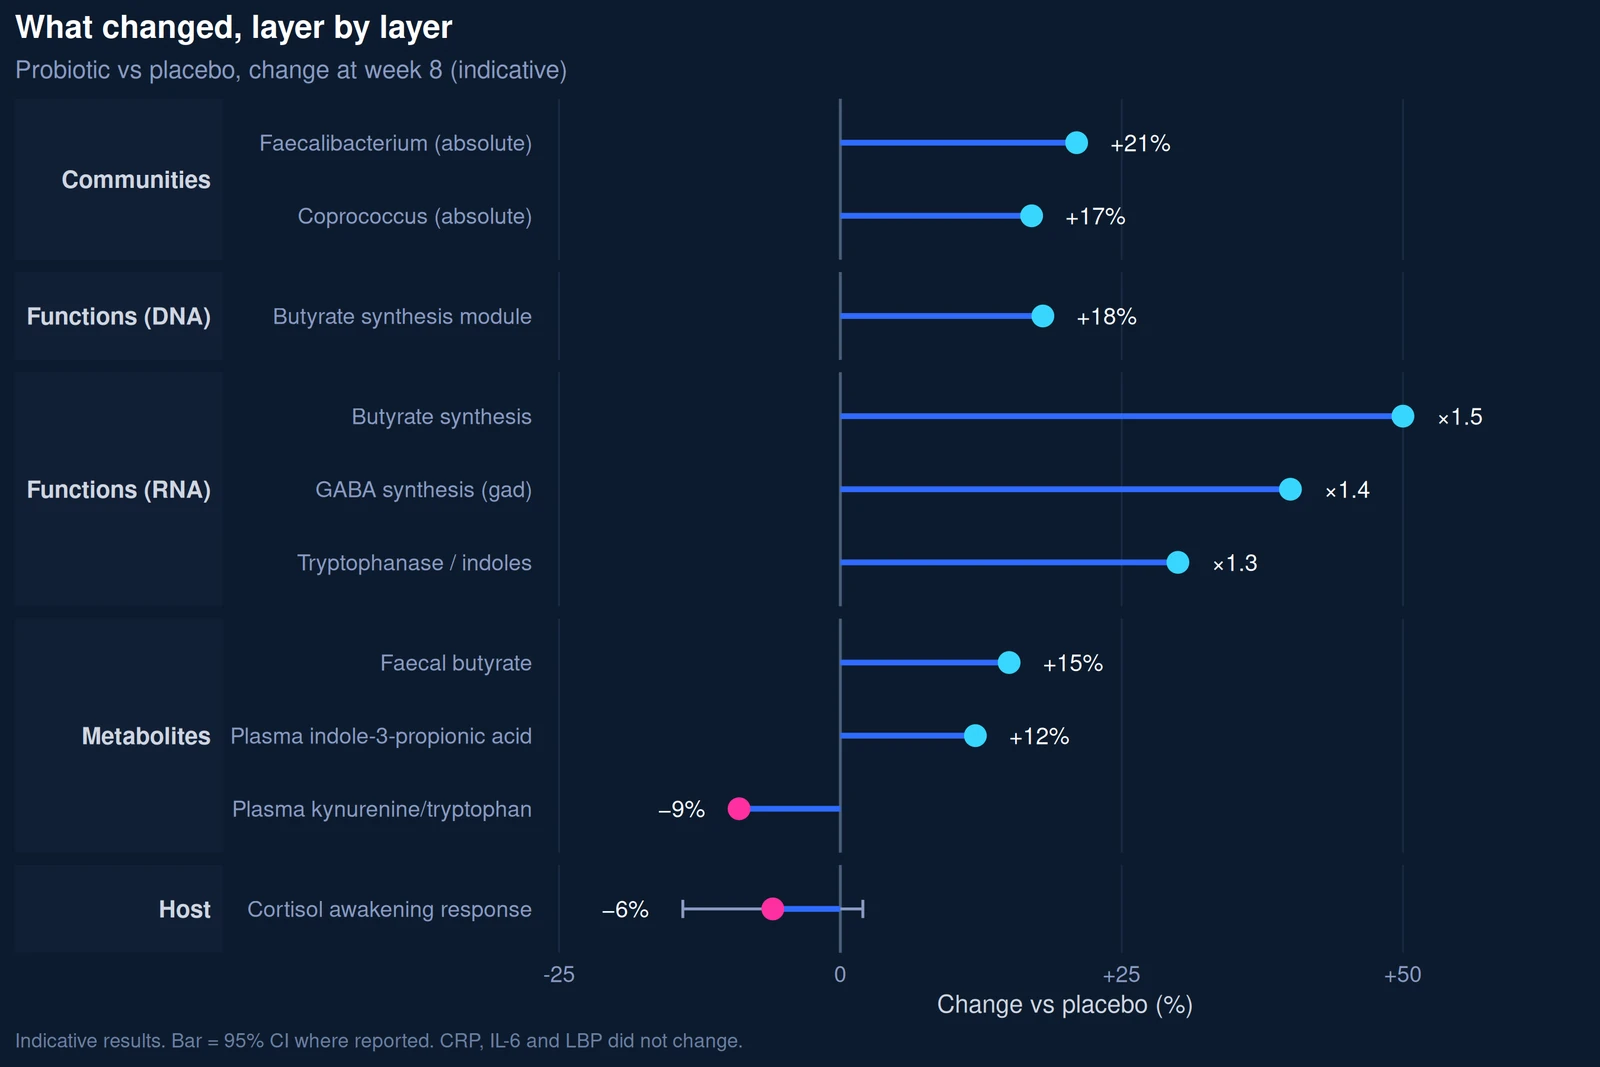
Faecal butyrate ↑ 15%
Plasma IPA ↑
Kynurenine/tryptophan ↓
Supported5Host signalling
CRP, IL-6, LBP unchanged
Cortisol response n.s.
Not shown6Perceived stress
PSS −1.6 vs placebo
~24% mediated by butyrate
ExploratoryInterpretation. The data support a coherent but partial mechanism. The strains engraft transiently and raise the community’s capacity, and actual activity, for butyrate, GABA and indole production; these products reach the circulation and shift tryptophan metabolism away from the kynurenine branch. The host signals expected downstream, systemic inflammation and the cortisol response, did not change at this dose and duration. The gut-to-host link is established; the host-to-brain link is not yet.
| Statement | Evidence | Verdict |
|---|---|---|
| “Product strains colonise the gut during intake” | Strain-level detection in 82% at week 8; 9% after washout | Supported: transient |
| “Increases the microbiota’s butyrate production” | Metagenome ↑, metatranscriptome ↑, faecal butyrate ↑ | Supported: 3 layers |
| “Shifts tryptophan metabolism towards indoles” | Plasma IPA ↑; kynurenine/tryptophan ↓; tryptophanase expression ↑ | Supported: 2 layers |
| “Gut-specific, without disturbing the resident microbiome” | Oral microbiome and resistome unchanged; no acquired resistance genes in the strains | Supported |
| “Reduces systemic inflammation” | CRP, IL-6, LBP unchanged | Not supported |
| “Dampens the cortisol stress response” | −6%; 95% CI −14% to +2% | Not supported |
| “Reduces perceived stress via the microbiome” | PSS −1.6 vs placebo; ~24% mediated by butyrate (exploratory) | Hypothesis: to confirm in a dedicated trial |
In the EU, health claims on foods and food supplements must be authorised under Regulation (EC) No 1924/2006 after EFSA assessment of human efficacy data. Mechanistic microbiome data strengthen the scientific rationale, trial design and scientific communication; they do not by themselves establish a claimed health effect.
Have a similar question?
Tell us your intervention, your matrices and the question behind them. We will propose a design, sampling, sequencing depth, layers and host read-outs, before the first sample is collected.
Discuss your study