CASE STUDY · IMMUNO-ONCOLOGY

Finding, and confirming, markers of response to checkpoint blockade

How Biomarker Xplorer combines whole-genome, whole-exome and bulk RNA sequencing for discovery with targeted quantification for confirmation, in an illustrative immuno-oncology study.

Illustrative case study. This scenario shows how Biomarker Xplorer is applied to an immuno-oncology question. It does not describe a specific client project: cohort sizes, results and timelines are indicative and depend on indication, sample quality and study objectives. Markers are drawn from published immuno-oncology literature; their combination here is hypothetical and is not a validated clinical test.

Download the full case study (10 pages, PDF)

1Design

Groups, endpoints and success criteria fixed before any sample is run

2Discover

WGS, WES and bulk RNA-seq on a balanced discovery cohort

3Narrow

AI models reduce thousands of features to a testable few

4Confirm

Targeted quantification on the full sample set, model locked

At a glance

Question
What separates patients who gain durable benefit from anti-PD-1 therapy from those who do not?
Setting
Clinical-stage biotech · phase II trial · anti-PD-1–based combination · advanced NSCLC
Groups
Durable clinical benefit (DCB) vs no durable benefit (NDB)
Full sample set
180 patients: pre-treatment tumour biopsy and baseline blood
Discovery
60 patients (30 DCB / 30 NDB): WGS, WES, bulk RNA-seq
Narrowing
≈21,400 features → 11 testable candidates (AI models, nested cross-validation)
Confirmation
Targeted RNA panel (RT-qPCR), dPCR and amplicon DNA panel on 174 evaluable FFPE samples
Outcome
7 confirmed markers in one locked score; held-out AUC 0.78 vs 0.62 for PD-L1 IHC alone
Duration
≈ 6 months

The challenge

PD-L1 immunohistochemistry and tumour mutational burden (TMB) are the most widely used predictors of benefit from immune checkpoint blockade, yet neither cleanly separates patients who respond from those who do not. A clinical-stage biotech running a phase II trial of an anti-PD-1–based combination in advanced non-small cell lung cancer (NSCLC) wanted to know which tumour features distinguish patients who gain durable benefit, to build an enrichment hypothesis for its next trial.

The brief: find the markers that separate the two groups, and prove they hold up before building on them.

01Design the study before running a sample
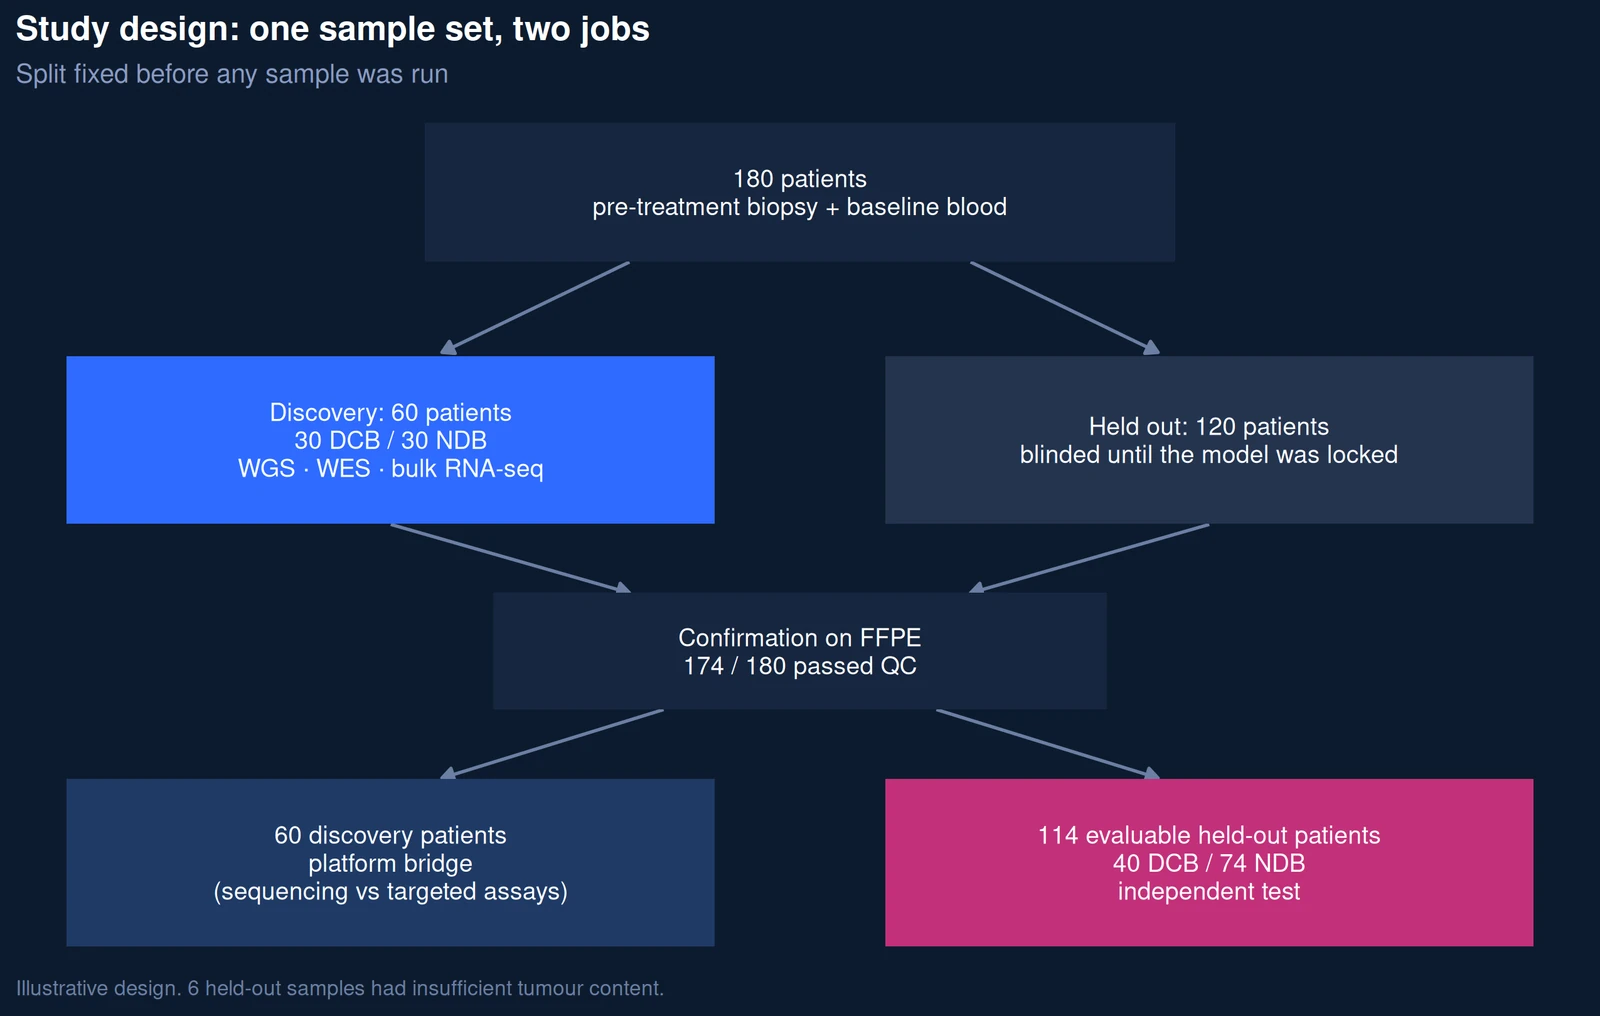
Study design: 180 patients split into a 60-patient discovery cohort and 120 held-out patients
Figure 1. Study design. The 180 patients were split before any sample was run. The 60 with good-quality frozen tissue formed the discovery cohort (30 with durable benefit, DCB; 30 without, NDB); the other 120 were held out and kept blind. All FFPE blocks then went to targeted confirmation, and 174 passed QC. The 60 discovery patients bridge sequencing and targeted assays; the 114 evaluable held-out patients (40 DCB, 74 NDB) form the independent test. Illustrative design.

02Profile the discovery cohort: three complementary layers

Each sequencing layer answers a different part of the immuno-oncology question. All three were run on the same 60 tumours, with matched blood as the germline reference.

03Narrow thousands of candidates to a testable few

Profiling produced ≈21,400 features per patient: gene-expression values and signature scores, mutation and copy-number features, HLA and neoantigen metrics. The goal was not the best-looking model in discovery, but a short list of candidates likely to hold up in new patients.
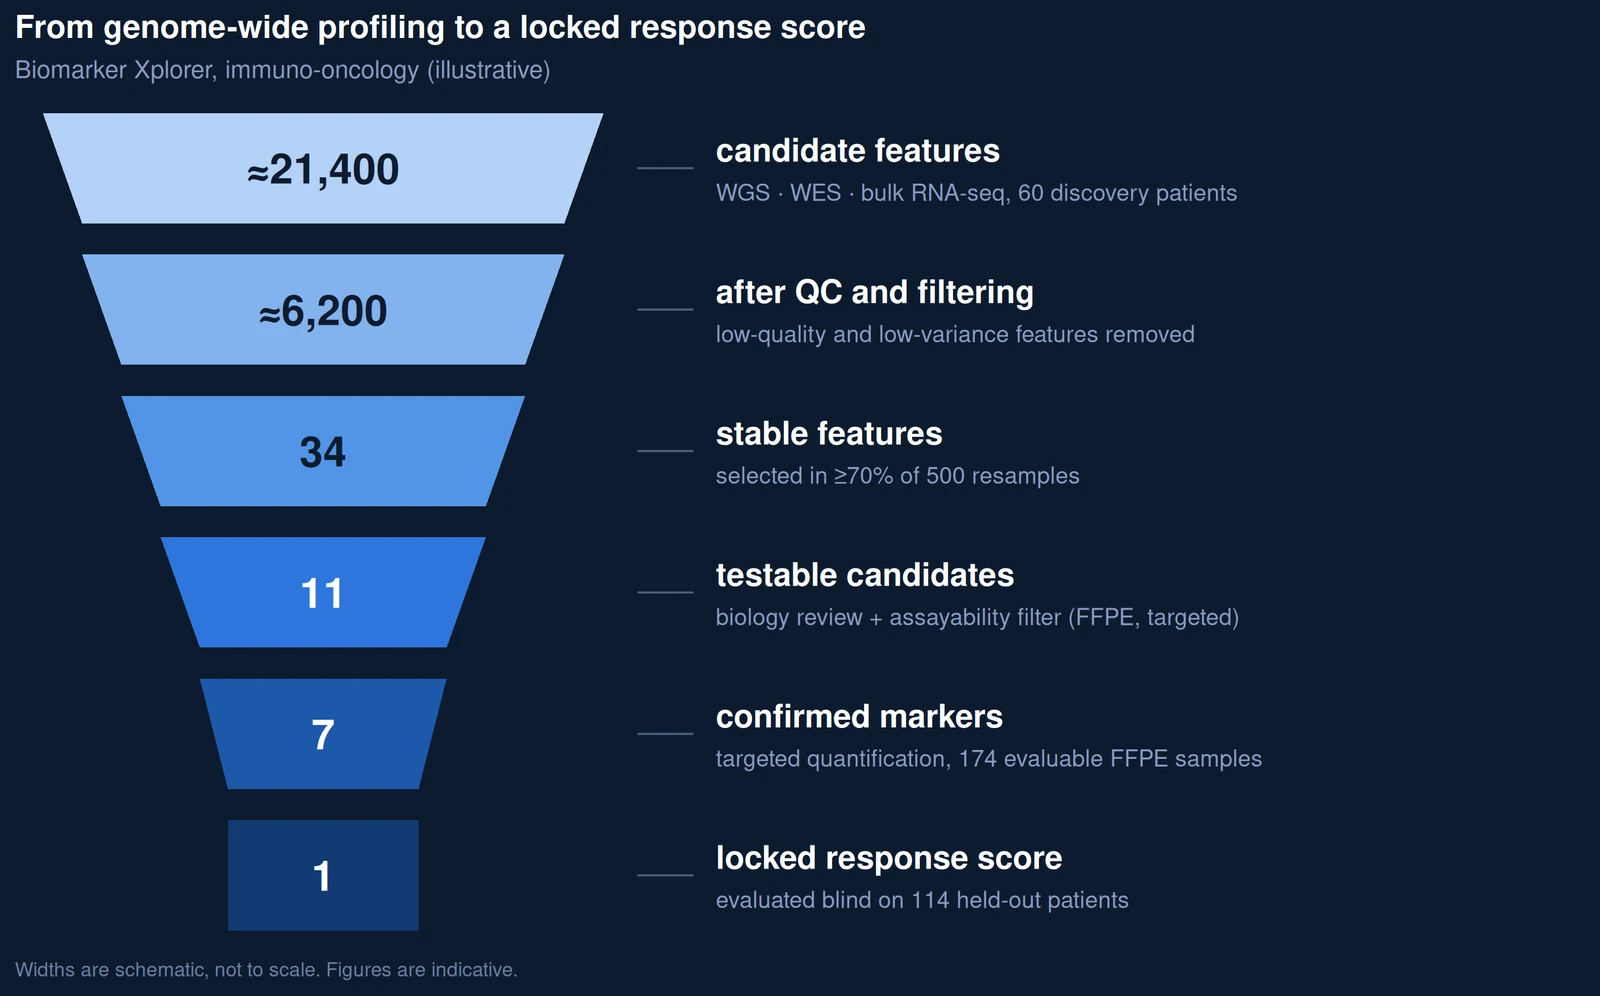
Funnel from about 21,400 candidate features to one locked response score
Figure 2. From genome-wide profiling to a locked score. Each level gives the number of features still in play: about 21,400 from WGS, WES and RNA-seq; about 6,200 after quality filtering; 34 selected in at least 70% of 500 resamples; 11 that can be measured by a targeted assay on FFPE; 7 confirmed in held-out patients and combined into one locked score. Widths are schematic. Illustrative figures.

The result: 11 testable candidates, each mapped to a confirmation assay. Cross-validated AUC in discovery was 0.84 (95% CI 0.74–0.94), treated as optimistic until confirmed.

04Confirm by targeted quantification on the full sample set

Three targeted assays were designed and analytically checked, efficiency, linearity, limit of detection and repeatability, following MIQE and dMIQE guidance14,15, then run on FFPE sections from all 180 patients. 174 passed QC (6 held-out samples had insufficient tumour content). The model was locked before outcomes for held-out patients were unblinded.

The drop from 0.84 in discovery to 0.78 in held-out patients is expected, and it is the held-out number that a development programme can build on.
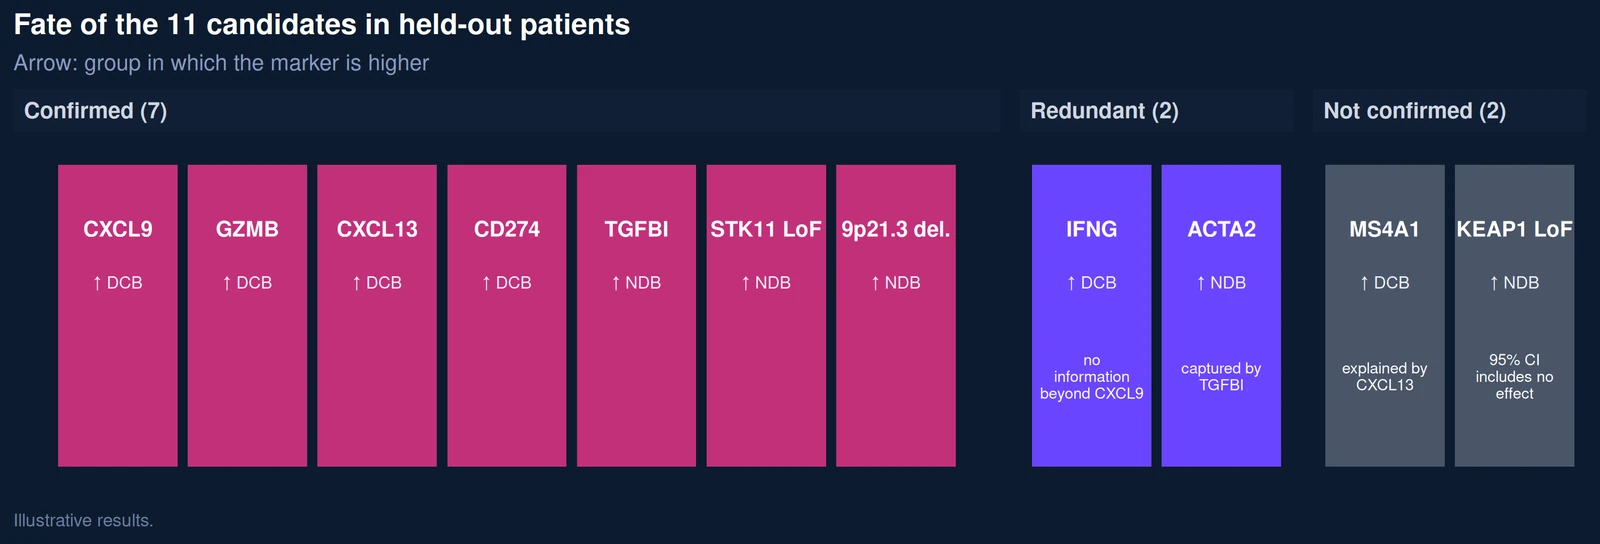
Outcome of the 11 candidates: 7 confirmed, 2 redundant, 2 not confirmed
Figure 3. Fate of the 11 candidates in held-out patients. Each tile is one candidate; the arrow gives the group in which it is higher (DCB: durable benefit, NDB: no durable benefit). Seven were confirmed in the pre-specified direction. Two were redundant: IFNG added nothing beyond CXCL9, and ACTA2 was captured by TGFBI. Two were not confirmed: MS4A1 was explained by CXCL13, and KEAP1 pointed the same way but its 95% CI included no effect. Illustrative results.
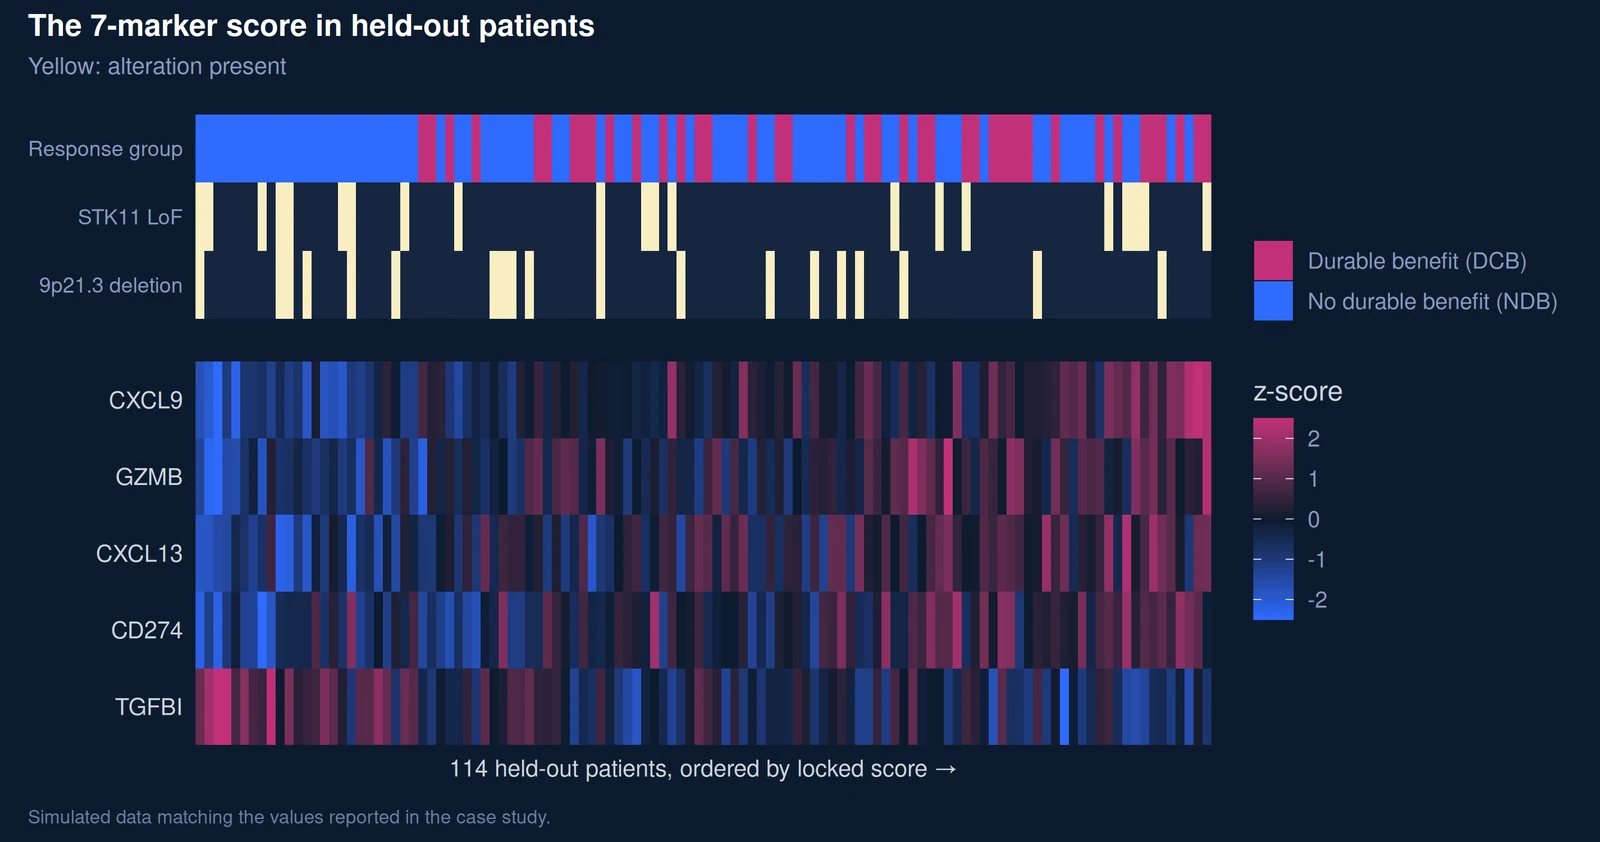
Heatmap of the expression markers, STK11 and 9p21.3 status in 114 held-out patients ordered by score
Figure 4. The 7-marker score in held-out patients. Each column is one of the 114 held-out patients, ordered from lowest to highest score. Top: response group, and presence (yellow) of STK11 loss-of-function or 9p21.3 deletion, two markers more frequent in patients without durable benefit. Bottom: expression of the five genes of the score, as z-scores (pink above average, blue below). CXCL9, GZMB, CXCL13 and CD274 rise with the score; TGFBI falls. Simulated data matching the case study.
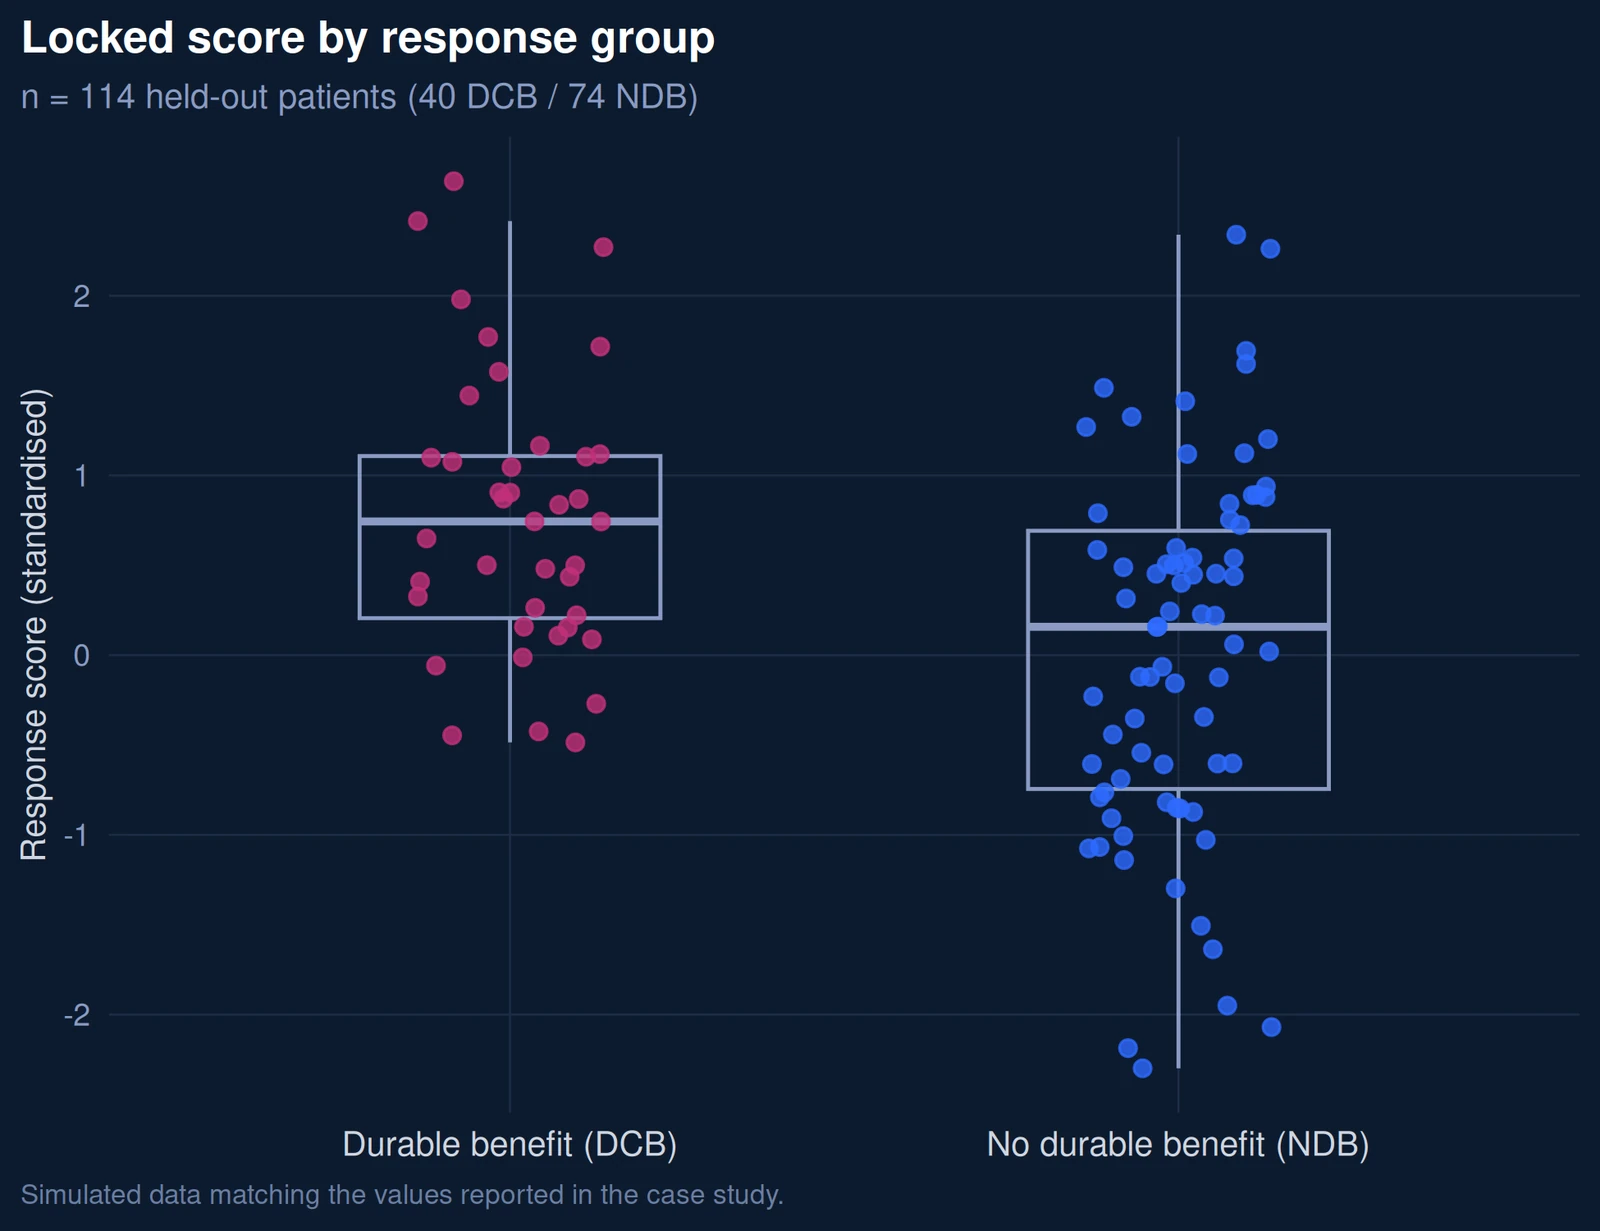
Locked score by response group: higher in patients with durable benefit
Figure 5. Locked score by response group. Each point is one held-out patient; boxes show the median and interquartile range. Scores are higher in patients with durable benefit, but the two groups overlap: the score ranks patients by likelihood of benefit, it does not classify every patient correctly. Simulated data matching the case study.
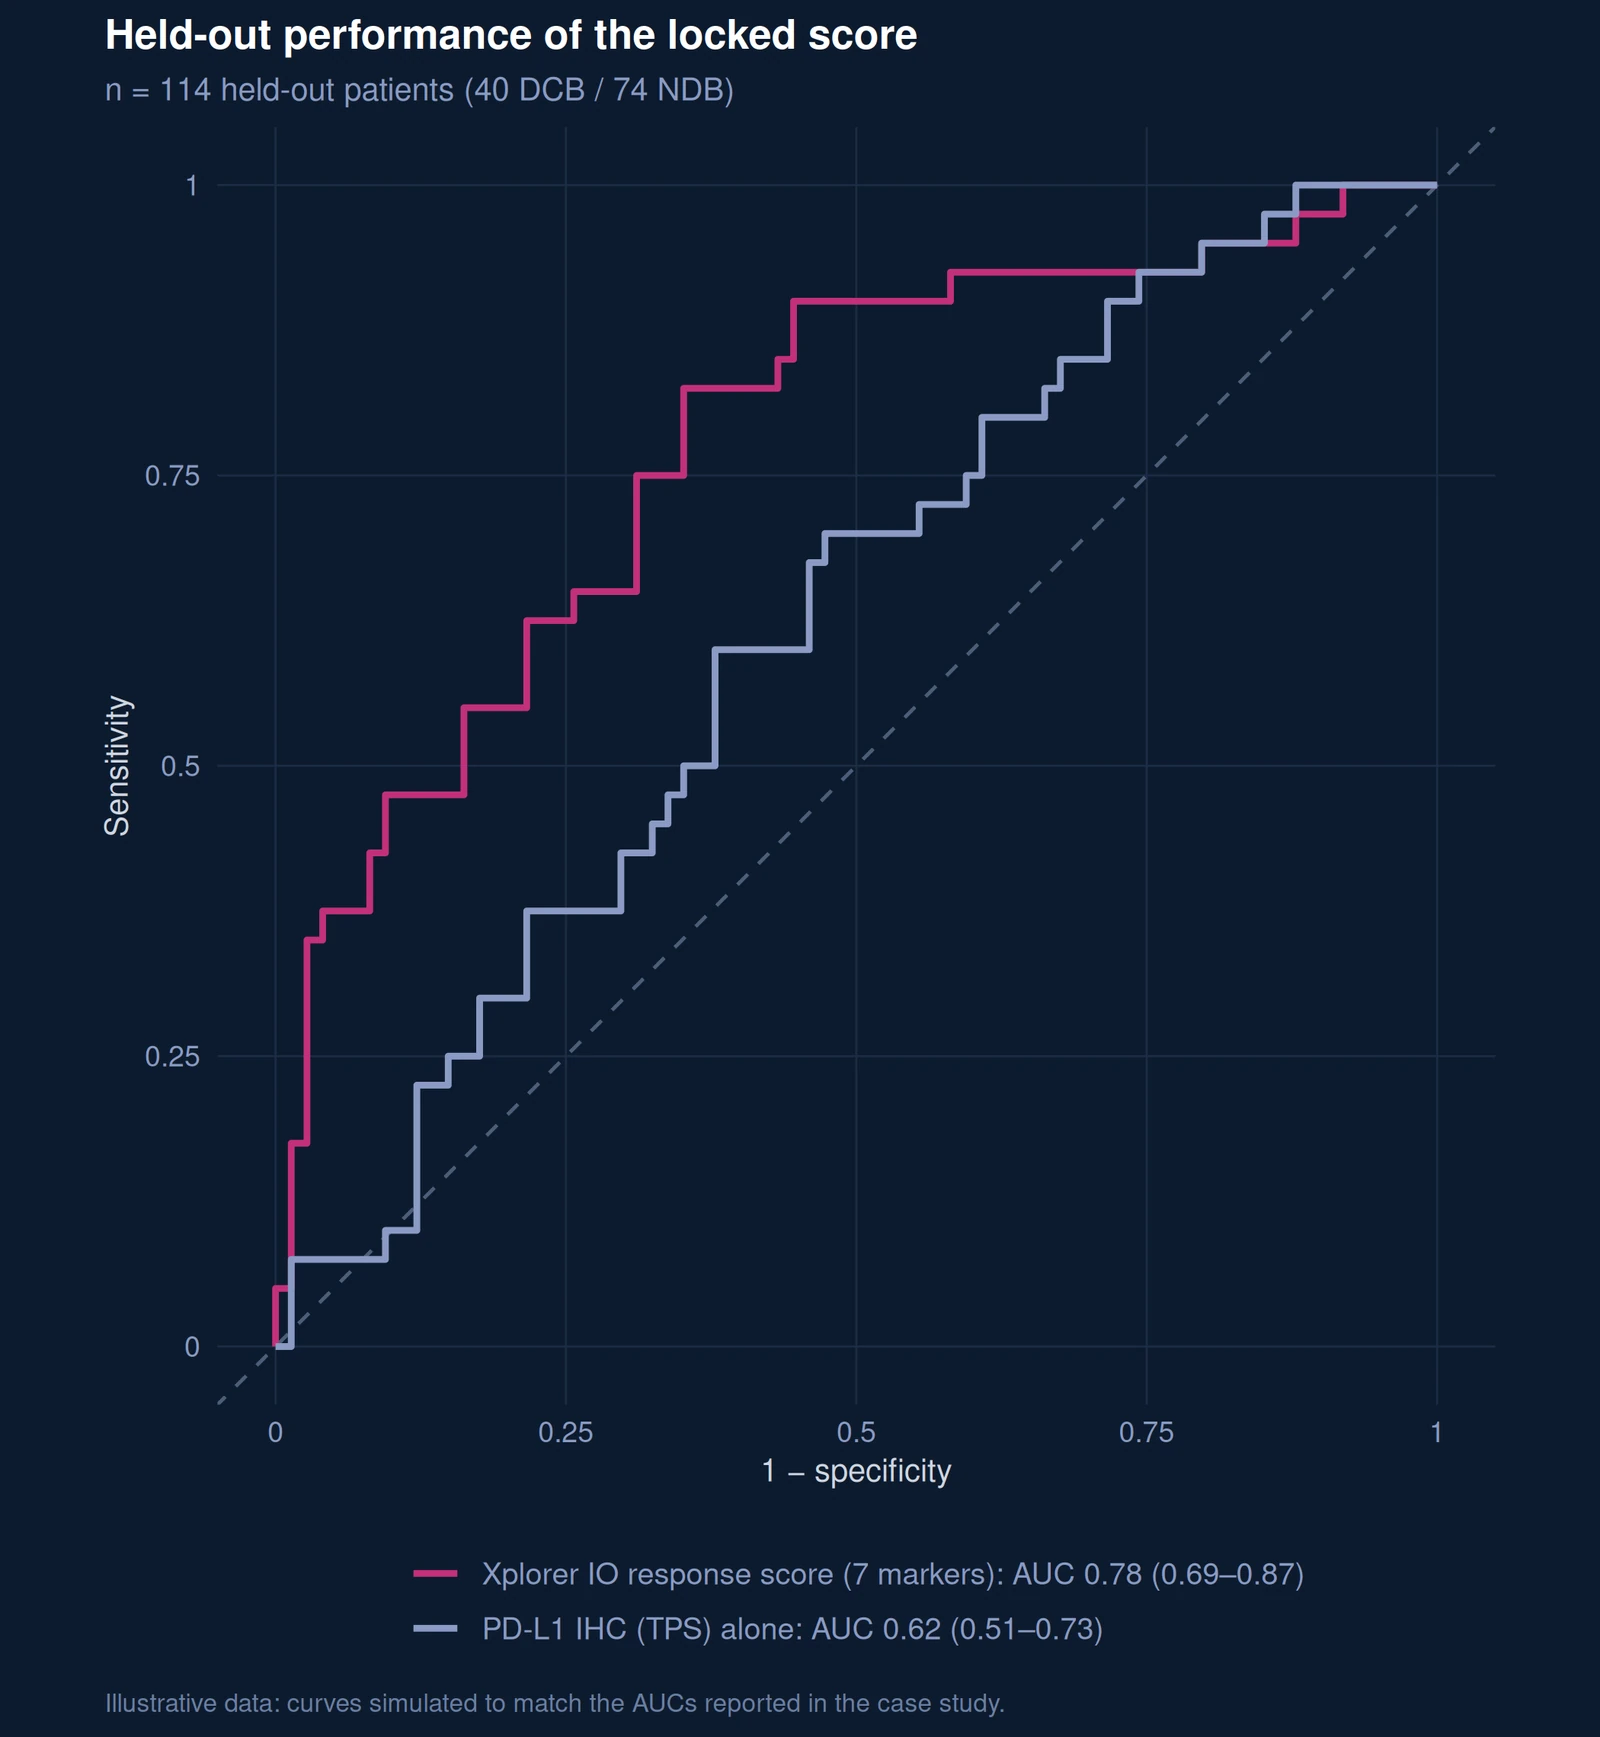
ROC curves of the locked score and PD-L1 IHC alone in 114 held-out patients
Figure 6. ROC curves in held-out patients. For every possible cut-off, a curve plots the share of DCB patients correctly identified (sensitivity) against the share of NDB patients wrongly flagged (1 − specificity); the diagonal is chance. The 7-marker score (AUC 0.78) separates the groups better than PD-L1 IHC alone (AUC 0.62), and adding it to PD-L1 TPS gives significant added value (likelihood-ratio test, p < 0.01). Curves simulated to match the reported AUCs.

What the sponsor received

References cited on this page (2)
  1. Bustin SA, et al. The MIQE guidelines: minimum information for publication of quantitative real-time PCR experiments. Clin Chem. 2009;55:611–622.
  2. dMIQE Group, Huggett JF. The digital MIQE guidelines update: minimum information for publication of quantitative digital PCR experiments for 2020. Clin Chem. 2020;66:1012–1029.

Full case study and all references (PDF)

Have a similar question?

Planning a biomarker study?

Tell us your two groups, your samples and the decision you need to make. We will propose a design, discovery layers, cohort split and confirmation assays, before a single sample is run.

Discuss your study